Regression Analysis Introduction
Today’s fantasy landscape grows more and more complex. When evaluating rookie prospects we have so many different stats and metrics to look at. The hard part is figuring out which ones are important and which do not matter. That is where regression analysis can come in and play a large role.
I will be using regression analysis to help build a predictive grading model that can be used to easily sift through many players to quickly identify guys to avoid and target. Our end goal when selecting rookies is who will be the best fantasy assets when they hit the NFL, and the best assets are the ones who score us the most fantasy points. To create my rookie model I used regression analysis and sorted through multiple different metrics to determine which correlated to NFL fantasy points per game (FP/G) the most and which correlated the least.
What Is Regression Exactly?
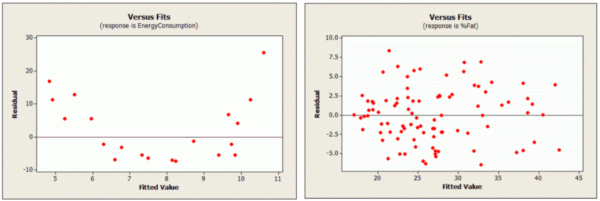
Regression analysis is a tool that takes an input (independent variable) and compares it against the stat you want to predict (dependent variable). In this case, our independent variables will be things like draft capital and reception share, and our dependent variable will be FP/G. Regression analysis takes these variables and then outputs all sorts of different stats that include a Residual Plot, R Square, and P-Value. All of these are very useful in determining the accuracy of a predictive model. The residual plots tell you your amount of error at each point. These plots are interesting because you do not want to have a predictable error, you want the error to be random. This is displayed in the following examples of good and bad residual plots.
How to Choose Your Regression Model
The plot on the left is the poor residual plot because your error is showing a predictable pattern. This means that a linear regression model is not usable for predicting this variable and an exponential plot would be much better. Conversely, the plot on the right shows unpredictable error, this means that a linear regression model will do a good job predicting your desired variable.
R-Squared
The next result of the regression model is your R Squared (R^2) value. This tells you what percentage of your dependent variables is explained by your independent variables. Keep in mind that this is not the same as overall accuracy, it is more so overall correlation. This number can be anywhere between zero and one with one being perfect and zero being no correlation. I have found that for the type of model I am creating an R Square of .3 is desirable but .6 is seen as very good. The following graphs show the difference between a good and bad R Square value.
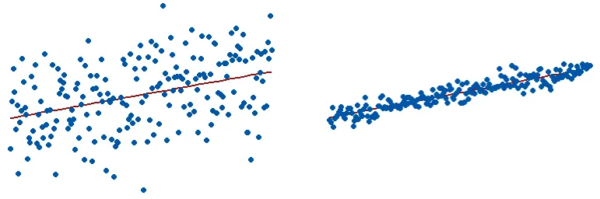
The graph on the left represents a model with a .15 R Square value, while the graph on the right represents a .85 R Square value. As you can see the right graph has the data points a lot closer to the line of best fit as compared to the left graph.
P-Value
Lastly, we have the P-Value. This is what tells you whether your independent variable has anything to do with predicting your dependent variable or not. The way this is measured is if your P-Value is larger than .05 then your variables do not correlate. If your P-Value is less than .05 then they do correlate. But, if your P-Value is under .001 then your variables are considered “statistically significant” meaning that your variables have a whole lot to do with each other. Now let’s get into my database and talk about what stats I used.
My Data Inputs
I collected a database of most of the relevant RBs drafted and undrafted back to and including the 2014 class: seven years of data. I then combined relevant stats that @DynoGameTheory and @LateRoundQB have outlined as being very common among elite NFL RBs. However, they haven’t outlined any real causation with these stats, just that they are commonly found among top RBs. The metrics are as follows: draft capital, 40 time, weight, BMI, best season scrimmage yards per game (BS SY/G), college career yards per carry (YPC), best season reception share (BS R%), best season touchdown share (BS TD%), and best season yards per team play (BS Y/TP). I used https://www.sports-reference.com/cfb/ to collect the stats for all of my players, so if they did not have stats there I did not include them in the database. It was just hours of data logging before I could start testing weights. After I got all my data in the database I went over to https://www.rotoviz.com/ to calculate all the players’ career FP/G in the NFL. Now that I have all of the independent variables as well as the dependent variable that I want to predict we can start running everything through the regression model.
My Data Outputs
The way the regression model works is it takes each players’ stat in the area you are testing and pairs it with their FP/G. Then it does multiple different calculations to find your residual plot, R Square and P-Value. Here are the results of this system for each metric’s P-Value and R Square, the residual plot will only be necessary once we get to the actual model grades.
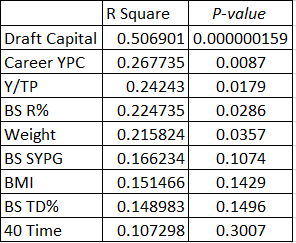
This chart lists each of the metrics in order of their relevance to FP/G. As we can see draft capital is by far the best predictor of fantasy points and it is not close. The low P-Value classifies it as the only metric to be statistically significant. The other metrics that are still good but not significant are YPC, Y/TP, BS R%, and weight. I still use the rest of the metrics in my model but they are weighted the absolute least. I then divided these metrics into six different tiers. Tier one is draft capital, tier two is YPC, tier three is Y/TP, BS R%, and weight. The fourth tier is BS SYPG, the fifth is BMI and BS TD% and the last tier is 40 time.
Crafting the Formula
Now onto actually creating a predictive model for rookie RBs. Since draft capital is as predictive as it is, I knew I wanted to make it the most important aspect of my model. I tried a few different methods but this is what I settled on. I ended up assigning a grade to their draft capital, the higher the capital the better the grade, and then combining the other metrics to scale to their draft capital. To do this I assigned a percentile score to each metric for each player. I had 95 players in my database. So, if you had the fastest 40 time you’d be in the 100th percentile for that metric. Or if you had the 80th-best 40 time you’d be in the 16th percentile, so the better your score the higher your percentile. I then multiply these percentiles based on what tier they fall in.
For example, let’s look at Saquon Barkley. He has a BS R% of 17.9 which is 90th percentile, BS R% is in tier three so I multiply this number by 4, which gives him a score of 360 for BS R%. I do this process for every metric for every player then I plug them into my secret formula to obtain my multiplier. Then, I take this multiplier and apply it to the players’ draft capital score. Boom, you now have your set of final grades for each player. Let’s see how accurately they predict FP/G at the NFL level.
I will show you the values that the regression analysis spits out to show you why you should trust my model. The first is the residual plot, remember this should be random and should not show a pattern.

Looks great! There is no pattern discernable pattern and the errors seem random. This is good because it means my rookie model can be graded accurately by the regression analysis. If we saw a bad residual chart then linear regression would not be able to grade my rookie model. This chart shows the difference between expected FP/G and actual FP/G based solely on the final grade that my model provides to each player. I waited until now to explain that because without getting all the background it is pretty conceptual and can be hard to understand. We can see that a large amount of the data points fall between the +/- five mark. This means for a majority of the scores my model predicts an expected FP/G within just 5 points of the actual. Now that we have determined a regression analysis is appropriate we can look at the resulting R Square and P-Value for my model.
The Model’s Effectiveness and Historical Results
The regression analysis gave my rookie model a .57 R-Squared, and a .0000000022 P-Value. That means that my model is well below the P-Value threshold for statistical significance and my grades have a 57% average correlation with NFL fantasy points per game. These numbers combined mean that my grading system is not only significant but also a very good predictor. Now we can dive into the grades and accuracy. I am classifying a “good” RB as any RB that had at least 10 fantasy points per game throughout his career. I was going to use top 12 and 24 seasons but this ends up including guys that were just career backups and maybe had one season where the starter got hurt and he filled in for some time to get a top 24 season. Doing 10 points per game pulls together a good list of guys that were consistent starters in the NFL and that is what we want out of our rookie picks.

Shown above is every player in my database that has a career FP/G of 10 or more. I feel like this is a pretty good list and exemplifies a good list of fantasy-relevant RBs over the last few years. This convinces me that 10 points were a good cutoff. Now the moment that we have all been waiting for, the grades. I will start with the historical grades and accuracy of the model, then I will end with the grades for this 2021 class.
The 2014 – 2020 Running Back Classes

There are some obvious misses and orders that can be fixed with just a bit of film watching. For example, in the 2018 class, my model graded Rashaad Penny a little higher than Saquon Barkley, but even if you did as little as watching a few highlight videos you would see that Saquon is better. These grades are not 100% and no model will ever be, but they are pretty solid. When looking at the model’s final grade vs career fantasy points per game (shown below) you can see a linear trend. This is a great sign and visually proves a good correlation between the model and future fantasy points.

The 2021 Running Back Class
As far as the colors go here is what they mean. The purple tier is for scores that are 110 and over, if you fall in this tier you historically have an 86% chance of hitting (a hit is defined by having 10 or more FP/G in the NFL). The blue tier is for scores that fall between 95 and 109, this tier has a 78% hit rate. The green tier is for scores between 76 and 94, this tier has a 77% hit rate. The orange tier is my ‘coin flips’, it is for scores between 35 and 75 and this tier has a 33% chance of hitting. Last is the ‘don’t touch’ tier, this is for scores that are 34 or lower and if a player finds himself here he only has a 21% chance of hitting. Finally, let’s take a look at this years’ RB class and their pre-draft grades.
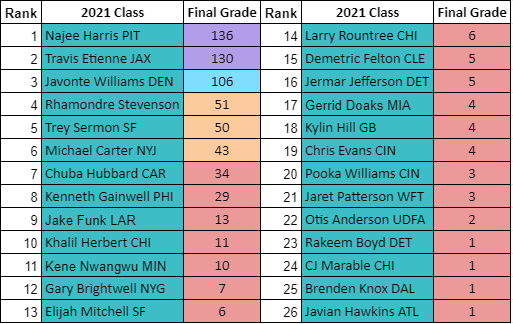
This chart kind of confirms what the public perception of this class has been, it is pretty weak. There are four guys that everyone talks about a couple of maybes following them and then a bunch of rejects to follow. Overall this class is a bit disappointing but it should instill a lot of confidence in Javonte, Etienne, and Harris. They all fall into tiers that historically have at least a 77% hit rate. Just keep in mind no model is perfect, these are not rankings, and as always watch film.
Guys to Watch
Two guys I want to touch that did not score very well but have good college production profiles are Jake Funk and Brenden Knox. Funk hits every production metric in my model which surprised me, and he only missed the size marks by one pound and 0.7 BMI. He is a guy I will definitely be targeting in the fourth or fifth rounds of my rookie drafts. As for Knox, he hits both of my size components at 223 pounds and a BMI of 30.2. Knox, unfortunately, missed every single production metric I look at but he is so close to hitting in each of them. The first is SYPG, I want to see 120 here and Knox had 116.6. For BS TD% I want 32% but Knox had 31%. My threshold for BS R% is 10%, Knox had a 7.4% here. Lastly, for Y/TP I want my RBs to have 1.9 or higher, Knox had a 1.71. He is very close to hitting all of these thresholds so he is another guy I will be looking at later in my rookie drafts.
Wow, you read all the way through! Thank you, I really appreciate you using your time to
enjoy my content. If you would like to talk to me about my article or ask me any generic dynasty or trade questions. You can find me on Twitter @ChrisMiles1017, DFF Draft Director. Shoot me a DM, they are always open. Come join the #DFFArmy where I provide #Dynasty, #Redraft, and #Analytics content, along with rankings for @DFF_Dynasty. Thank you so much!