

Active dynasty leagues are the best leagues. Nobody wants to be in a stale league where owners don’t trade much, there is constant turnover in ownership from year to year, some teams are competitive (in spirit) and some are either purposely tanking or tanking due to how bad they suck. The best leagues are the ones where everyone is competing to win, trading is high, waiver claims are high, smack-talking is high, and so forth.
To the extent that I have had dynasty fantasy football (FF) success, and more specifically that I’ve been able to turn a bad team around quickly, I have long wondered if the prospects for doing so are better in a more active league. And that the real implication here is that inactive leagues really are the worst, making it much more difficult to achieve success.
Are Things Like Trading Volume & Waiver Activity Possibly Correlated With FF Performance?
I am going to dive into the history of an FFPC style dynasty league that recently disbanded after the 2020 seasons and look at this question of activity possibly being a driver of success. It was a custom league made up of eight individual 12-team leagues that each operated independently except for the league playoffs consisting of a combined 32-team points race in Weeks 15-16 (under previous NFL scheduling) after a one-week play-in during Week 14 among the #3 to #6 seeds. However, the big twist, is that this league was set up to put half of the annual dues into escrow for the 2020 jackpot season. We did our startup in 2015 and each year 1st place paid out $1,000 down to 12th place playing a measly $55. Buy-ins were only $55 per season but this made for a ~$21,000 jackpot prize pool for 2020 where first place paid $5,000 down to $300 for 25th place. Since each of the eight sub-leagues operated independently, we were allowed to own multiple teams so long as they were in different sub-leagues. I owned five teams in this league and acted as commissioner for the last three seasons. We called it Legends of the Gridiron (LOTG).
One Of My Squads Was Terrible In 17 But Took First Place In 18, 19, And In 20 For The Jackpot & A Three-Peat Mic Drop
How did I do it? Well that’s a long story and there was a lot of luck involved, but after analyzing the league history and running a bunch of comparisons, I am convinced one of the biggest reasons I was able to turn my team around and make it into a monster was because that particular sub-league was one of the most active in the overall consortium of eight leagues. How active? Here is a breakdown of every trade made in the history of this thing, except for trades from the original 2015 startup. It is also worth noting that there was not quite the volume of trading during the 2020 season because there was no future to think about. My championship team was from L7 below.
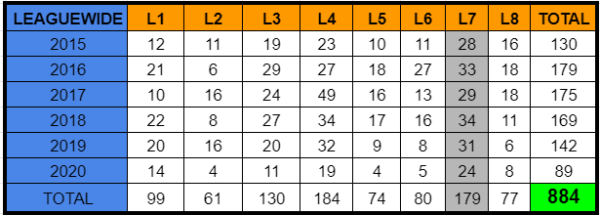
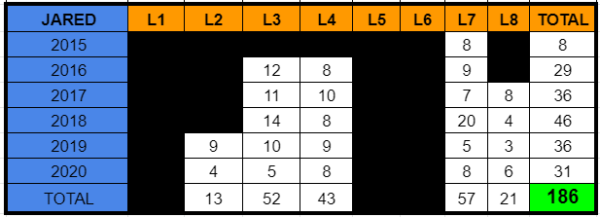
* I trade a lot. There were 96 franchises in this league. 576 total franchise seasons in this dataset.
2018 was clearly the year I turned it around. I made 20 trades that year for that squad. That is more trades than entire sub-leagues made throughout 24 complete league seasons. L2 never made 20 in an entire season. Neither did L5 or L8. I had a team in L8 that I thought was incredible in 2017 but I was never able to recover from some setbacks there because of just how stale that league was. Or so goes my theory.
Ok But What About Correlating This Stuff, And What About Waiver Activity?
This league had a blind bidding waiver system, just like FFPC uses. We started each season with $1,000 of bidding credits. Here is a very raw look at all 576 franchise seasons with a plot of waiver dollars spent in a given season vs fantasy points (FP) scored per week for that franchise.

Ok, that is a lot of noise and very little correlation, but quite a bit more than zero and there is something there to suggest activity level is related to success. But when we look at that noise, there are all kinds of things to pick apart, and yet there is perhaps some truth we can glean.
The most glaring and obvious problem here is that an owner that is headed toward the playoffs in a given season, is going to keep hustling and fighting to win, whereas someone whose season is headed in the opposite direction is more likely to taper off their activity level, at least a bit. However, to the extent that this effect would skew our data, it is perhaps a bit mitigated by the fact that there are plenty of seasons where an owner spent everything they had and still scored terrible totals each week. On the other side, there are several seasons where owners didn’t spend hardly anything but still scored a lot. To the extent that these factors might cancel each other out (even just a little), I think it is fair to say there is at least some signal between activity level, where waiver activity is being used as a proxy, and fantasy success.
Let’s look at it another way and see if some of that noise can be smoothed out. In this league, like FFPC, standings are not based purely on H2H records nor total FPs. It is based on Victory Points (VPs) only. VPs are awarded as follows: Two VPs for a H2H victory and zero VPs for a loss. Simple enough. Two more VPs are awarded for the four highest-scoring teams of the given week (within each of the eight sub-leagues), one VP is awarded for the middle four scoring teams, and zero for the lowest four. This is meant to be a happy medium between the schools of thought between H2H records and FPs. It gives credit to a team that scores high while losing its matchup, while also giving credit for H2H wins.

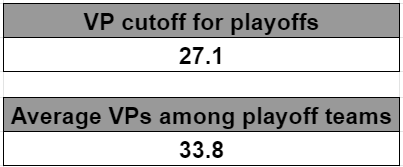
Ok, so once again a very similar story. There is just a little bit larger correlation when we look at it this way. By the way, blind bidding dollars can be traded and there was one owner one season that acquired $35 extra and then never spent it and finished the season spending a negative value here. That is why there is one dot to the left of the y-axis.
Ok, one more attempt and maybe I can find a bigger correlation. What about the trading volume as a potential signal?

* VPs here is the average needed to make the playoffs throughout the history of the sub-league
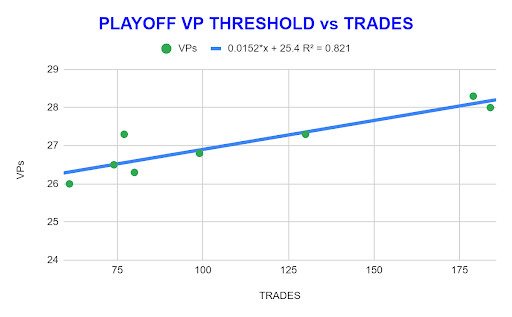
I was not expecting anything remotely close to this level of correlation. It more than likely needs to be taken with a very big grain of salt. In no way, shape, or form am I condoning trading more just for the sake of trading. But in an FFPC format where things can change dramatically from one season to the next, it helps to be an active owner in terms of looking towards the future and being willing to churn one’s roster. It may not be so much that activity level directly leads to success, but rather inactivity is a killer.
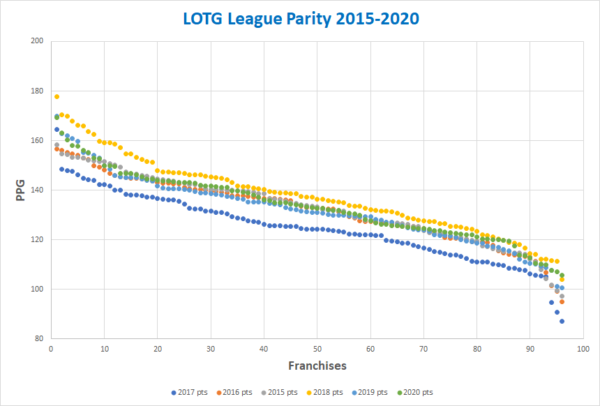
There are a large number of other factors that led to this particular squad of mine taking down the title three times in a row. But those 20 trades I made in the 2018 league season are where things turned around for me, along with several really good draft picks. I’m going to close with one more fancy graph that shows what I think is a great cross-section of what parity looks like, or doesn’t look like, across 96 teams and six seasons. It also clearly shows 2017 as a down year for scoring while the other five seasons look remarkably stable. If you drill down into the data on this, you will find numerous examples of poor teams at the bottom right of this graph that turned it around and become one of the highest-scoring teams in the league at the top left in subsequent seasons. And teams that went from the penthouse to the outhouse as well. Don’t let your team or league go stale!
Thanks for reading! Feel free to reach out to me to chat about fantasy football on Twitter @Ship_Chaser and follow along with me on my journey as I chase six-figure paydays! Look for my new articles soon!

